Quickstart
The example builds a benchmark cube in which one drought splits into two lobes and two others converge, runs DRIFT with the configuration selected in the benchmark, compares it with a three-dimensional connected-component detector and scores both against the known events.
import numpy as np

import driftdrought as dd

# 1. A benchmark cube: one drought splits into two lobes, two others converge (60 months x 60 x 80 cells)
index, truth, meta = dd.synthetic.generate("S3_splitmerge", noise=0.6, seed=3)
area = np.ones(index.shape[1:])          # unit cells; use dd.cell_area_km2(lat, res) on a lat-lon grid

# 2. DRIFT with the configuration selected in the benchmark (smoothing 2.5, auto:3, gamma 1, inheritance)
x = dd.smooth(index, 2.5)
labels, info = dd.detect(x, area, v_min=50, floor=0.5, footprint="watershed", ext_floor=0.5)
print(info.round(2).to_string(index=False))

# 3. A reference detector: 3-D connected components at one threshold
ccl = dd.baselines.ccl3d(x, thr=-0.5, cell_area=area, min_volume_frac=0.1)

# 4. Scores against the known truth
for name, lab in (("DRIFT", labels), ("CCL-3D", ccl)):
    h = dd.metrics.hota(truth, lab, area)
    m = dd.metrics.object_match(truth, lab, area, iou_thr=0.25)
    print(f"{name:7s} HOTA {h['HOTA']:.3f}  DetA {h['DetA']:.3f}  AssA {h['AssA']:.3f}  "
          f"F1(IoU>=0.25) {m['f1_iou25']:.2f}  events {m['n_pred']} (true {meta['n_events']})")
Output (scores against the known truth):
DRIFT   HOTA 0.574  DetA 0.628  AssA 0.525  F1(IoU>=0.25) 0.86  events 4 (true 3)
CCL-3D  HOTA 0.493  DetA 0.390  AssA 0.636  F1(IoU>=0.25) 0.80  events 2 (true 3)
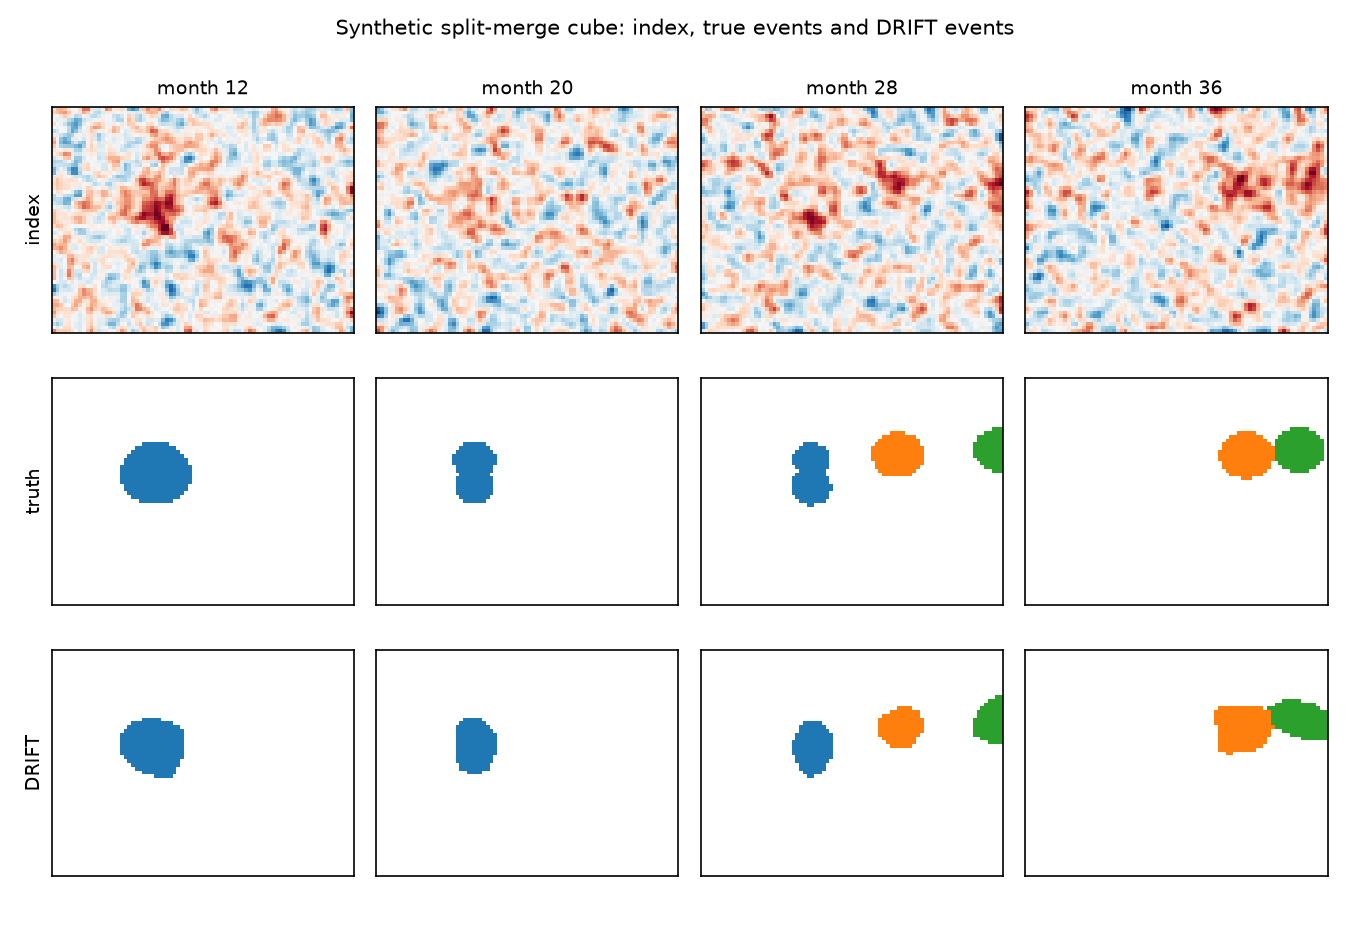
DRIFT finds the three droughts with a higher detection accuracy (DetA) than one cut at a single threshold. It describes the splitting drought as two events (its parent and its lobes), which costs association accuracy (AssA): at this smoothing the split itself is not recognised, a limitation discussed in Method.
Real data
On a latitude–longitude grid, give DRIFT the cell areas and a minimum volume in km² × months:
import numpy as np, xarray as xr
import driftdrought as dd

spi3 = xr.open_dataset("spi3.nc").spi3                      # (time, lat, lon), NaN over sea
area = dd.cell_area_km2(spi3.lat.values, 0.25)[:, None] * np.ones(spi3.lon.size)
area[np.isnan(spi3.values[0])] = 0
x = dd.smooth(spi3.values, 2.5)
floor, scan = dd.select_floor(x, area, v_min=2e6)          # event-count stability rule
labels, info = dd.detect(x, area, v_min=2e6, floor=floor)  # episodes
pulses, _ = dd.detect(x, area, v_min=2e6, floor=floor, selection="leaf")   # pulses
table = dd.event_table(labels, spi3.values, area, times=spi3.time.values)