Gallery
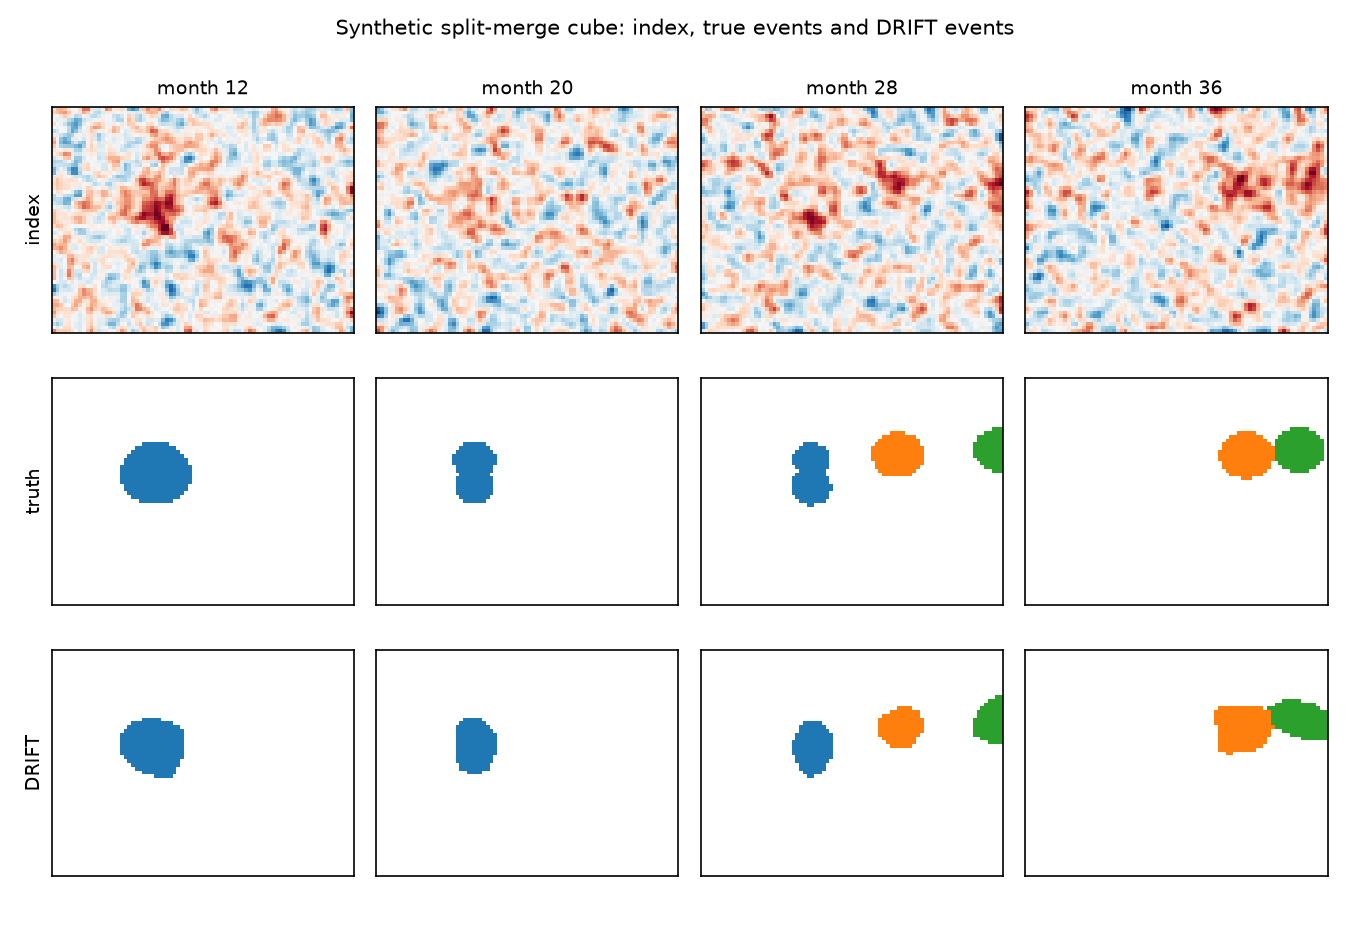
All figures are produced by examples/quickstart.py and examples/make_figures.py.
One threshold versus the whole tree

(a) Labelling at one threshold gives a different set of events at every level. (b) DRIFT keeps the whole hierarchy: each maximum is a branch whose persistence is its peak minus the saddle where it joins a higher branch. Branches with persistence below the noise-adaptive threshold are absorbed; the small maximum on the right (P = 0.39) is a candidate for absorption, whereas the deep saddles separate the three droughts.
Benchmark scenarios

Top: true events collapsed over time (colour: first month). Bottom: the index in month 30. The last column uses the
bundled library of 99 real drought shapes from the Amazon and Orinoco basins
(driftdrought.synthetic.example_library()).
DRIFT and reference detectors

Mean HOTA over ten seeds per scenario. DRIFT scores highest in the isolated, migrating and split–merge scenarios; for weak events in strongly correlated noise (S4) every method scores low.
Choosing the floor

Number of events and instability for each candidate floor (driftdrought.select_floor()). The selected floor is
the most stable one among the eligible floors.
Episodes and pulses

Episodes are the events selected by DRIFT; pulses are the leaves of the condensed tree inside them. Here two neighbouring droughts form one episode that contains two pulses.
Quickstart cube